The Incredible Shrinking Reform
What happened to Act 73, what H.955 actually does, and a rebuilt vtact73.com to help every Vermonter follow along

This is the third piece I've written about Vermont's education system. The first, "Vermont's Education Spending Problem, in Charts," laid out the data. The second, "What the Data Actually Says About Vermont's Education Reform Options," responded to one of my local representatives on consolidation and CESAs. I won't re-litigate either here, but they're the foundation this piece stands on. As always, every claim below carries a link, either to the page on vtact73.com that visualizes it or to the original source. Tell me what I got wrong, and bring evidence.

The 2026 legislative session ended the way it ran all year. Loudly, late, and over education.
For months, Governor Scott said he would veto any reform bill that didn’t force school districts to merge, and threatened to keep the Legislature in Montpelier through the summer to get one. Some Democratic leaders flirted with mandatory mergers themselves before concluding the votes didn’t exist in either party. The task force that Act 73 created to draw a new district map had already refused to draw one. A House bill passed in April over a veto threat. The Senate rewrote it in May. A conference committee made 22 more changes and wrapped up near midnight. And then, on May 29, the thing that had divided the building all year passed the House 125 to 10 and the Senate on a voice vote, and everyone went home.
“It was actually not that complicated in the end,” Senate Education Chair Seth Bongartz said afterward. Hold that thought.
If you caught fragments of this in headlines and could not say exactly what changed, you are in good company. The bill is dense, the coverage was incremental, and the single most important fact about it has gone almost entirely unstated. So let me state it.
H.955 does not replace Act 73. It amends it. Both are law. The funding formula you’ve heard about is still coming. The consolidation push is still on. What changed is the route and the timetable. The honest way to read Vermont education reform in 2026 is “Act 73, as amended by H.955,” and everything in this piece flows from that frame.
One more thing before we start. I’ve rebuilt vtact73.com from the ground up to explain exactly this, in plain language, for every Vermonter. More on that below.
(A status note. As I write this, H.955 has passed both chambers but has not yet been signed. The Governor negotiated the final compromise and is expected to sign it. I'll treat it as law-in-waiting throughout.)
What Just Happened in Montpelier
The story of this session starts last November.
Act 73, signed in July 2025, ordered a Redistricting Task Force to propose maps consolidating Vermont’s 119 school districts into 10 to 25 larger ones. In November, that task force voted 8 to 3 to refuse, recommending voluntary mergers and regional service entities instead and concluding that maps “would not reliably lower costs, improve outcomes, or expand equity.” The Governor’s verdict was two words. “They failed.” Whatever you think of the task force’s reasoning, the practical effect was enormous. The mandate Act 73 had on paper died that day, and the 2026 session became a search for what to put in its place.
H.955 was the answer. The House passed its version 79 to 62 in April, a bill built around voluntary processes and seven new regional service agencies, with the funding formula pushed out two years. Scott threatened a veto. The Senate rewrote the bill substantially, compressing the delay to one year and attaching real financial consequences to the merger process, and passed it 27 to 2 on May 26. The conference committee then resolved the differences, mostly in the direction of more pressure and an earlier timeline. The trade at the center of the final deal, as VTDigger reported it, was straightforward. Scott dropped his demand for forced mergers, which had no caucus support in either party, in exchange for a faster path to the funding formula and tools to constrain spending along the way.
So what survived from the original Act 73, and what changed? The finance architecture survived nearly intact. The foundation formula, the statewide tax structure, the spending caps, the homestead exemption, all of it is still coming, one year later than planned. What changed is the consolidation engine. State-drawn maps are out. In their place is a system of mandatory negotiation, voluntary votes, and asymmetric financial pressure. And one thing was added that appeared nowhere in Act 73 at all, a new layer of seven regional agencies called CESAs.
You can walk through this whole sequence on the dashboard’s How it changed timeline, which follows the plan from the Governor’s original proposal through every compromise to where it landed.

What H.955 Actually Does
Five things, in rough order of importance.
First, it keeps the funding formula. This is the part of Act 73 that changes how money actually moves. Today, each district decides what to spend and the state equalizes tax rates around those decisions. Under the new formula, the state calculates what each district receives. Every student generates a base amount ($15,033 in fiscal 2025 dollars), multiplied by weights for poverty, English learners, special education, and grade level.
A correction I will keep making as long as the confusion keeps circulating. That $15,033 is not what districts will spend per student. It’s the base brick before any weights are applied. Statewide, weighted membership runs roughly one and a half times actual headcount, so funded spending per real student lands in the mid-to-high $20,000s for most districts. When the Joint Fiscal Office modeled the formula, the statewide effect was a reduction of about 6 percent, not a halving. The formula redistributes. High-need districts gain. Low-need districts lose, and Norwich, where I live, was modeled at minus 34 percent, the largest cut in the state. The same formula cuts one town and lifts another, driven entirely by each district’s mix of students. One caution on those JFO figures, which I’ll expand on below. They were modeled against a draft district map that no longer exists, so treat them as directional, not predictive.
Second, it delays the formula and attaches conditions. Act 73 said July 2028. H.955 says July 2029, and only after the Legislature passes follow-up bill(s) resolving how the formula handles career and technical education, special education, sparsity, a secondary-grade weight, geographic cost differences, pre-K, and legacy debt. Read generously, this forces the Legislature to finish designing the engine before turning the key, which answers a fair critique that Act 73’s weights were under-built. Read skeptically, the formula’s start date now depends on the 2027 Legislature passing legislation that don’t exist yet. Each condition is a checkpoint. Each checkpoint is a potential stall. I’ll say plainly that I think the 2027 session is now the single biggest risk to this entire reform.
Third, it replaces state-drawn maps with pressured local choice. Every district must participate in a facilitated merger committee starting this fall, negotiating in good faith toward new districts of at least 2,000 students. Voters decide on Town Meeting Day, March 7, 2028. The pressure is real and worth itemizing.
Districts found negotiating in bad faith are publicly named and lose state aid for legacy construction debt.
School construction aid, which nearly every district with aging buildings will need, pays 30 percent for a district that stays solo and up to 75 percent for one that consolidates.
Districts under 750 students that haven’t merged land on a public state list in 2029, with recommendations for merging them anyway.
And merged districts are locked in, with withdrawal petitions barred through 2035.
Fourth, it creates seven CESAs. Cooperative Education Service Areas, regional public agencies sitting above the 52 supervisory unions, each with its own board and executive director, intended to deliver shared services like special education, business operations, and IT. Every supervisory union is assigned to one. Buying services is optional. I’ll come back to these at length, because I think they deserve more scrutiny than they’ve received.
Fifth, it builds out school construction aid and keeps Act 73’s spending caps, including the supplemental spending cap that limits how far districts can spend above the formula once it’s live.
That’s the inventory. Now the case for it, stated as fairly as I can.
Vermonters told their legislators, loudly and repeatedly, that they wanted a say in what happens to their schools. Forced mergers were politically dead, not because of lobbying but because neither party’s caucus would vote for them, and Democratic leaders reached that conclusion independently of the Governor. A reform that passes 125 to 10 exists. A purer reform that dies in a veto fight does not. House Majority Leader Lori Houghton’s floor case was that the bill “delivers a transformation plan focused on a strong public education system that expands opportunities for our kids, keeps decisions local and will save money.” The first two clauses are defensible. The third is the bet this whole piece is about.
The New vtact73.com
When I built the original dashboard in February, it was a personal tool that escaped the lab. It was Norwich-centric, heavy on the JFO’s preliminary modeling, and it aged quickly as the Legislature kept moving. So I rebuilt it, from scratch, with a different job in mind.

The new vtact73.com is a nonpartisan, plain-language guide to what Act 73 (as amended) actually is, why it exists, what it’s expected to do, and what happens next. This topic is dense, and I don’t think it’s well understood, through no fault of busy people living busy lives. If the site helps Vermonters walk into a merger committee meeting or a Town Meeting Day vote understanding the system they’re voting on, it has done its job.
The site is built as a guided tour in four parts, and they build on each other. It starts with Understanding Act 73, a plain-language walk through what the law is, why it exists, and the two big ideas at its center, reorganize the structure and change how the money flows, along with short answers to the questions Vermonters ask most (these FAQ’s are a great place to start). The structure then shows, layer by layer, how a Vermont child’s education is actually delivered, from the state through supervisory unions and districts down to schools and students, and how each layer changes from today through the reform. How it changed follows the plan from the Governor’s original five-district proposal through every compromise to where it landed. And What’s next walks the road ahead step by step, the agencies, the merger votes in 2028, the formula in 2030, including a hands-on look at everything that has to line up for the formula to switch on.

Behind the guide sit the refreshed data sections, covering where the money goes, 20-year spending trends, teacher pay, outcomes, and demographics, all re-verified against the latest federal data, plus a new analysis, money vs. results, that I’ll return to shortly. One number from those pages is worth carrying through the rest of this piece. Of roughly $28,800 spent per pupil, only about a quarter is actual teacher salary, and Vermont’s average teacher salary sits below the national average. I’ve come to think of it as the teacher’s sliver. Whatever is driving Vermont’s costs, it is not generosity to the people in the classroom.
I also removed things, and I want to be transparent about why. The original site’s Norwich tax modeler and most of the visualizations of the JFO’s district-by-district modeling are gone. That modeling was built against a draft map the task force refused, and under H.955 the real district boundaries won’t exist until voters draw them in March 2028. The hypothetical districts are simply out of date now. The formula’s direction is real and largely map-independent, which is why I still cite the topline figures in this piece, but presenting district-level dollar tables as if they were predictions would invite exactly the confusion I’m trying to reduce. If the JFO or the merger facilitators publish updated modeling against real merger groupings, and H.955 requires the facilitators to provide committees with up-to-date fiscal modeling, I’ll bring those visualizations back with the caveats they deserve. And because this guide is built from the laws themselves, the site links the primary sources directly, the enacted text of Act 73 and every version of H.955, so you can check my reading against the originals.
Explore it. Challenge it. Tell me what I got wrong.
Addendum: a new tool — Your School Snapshot
Added 6/17/26
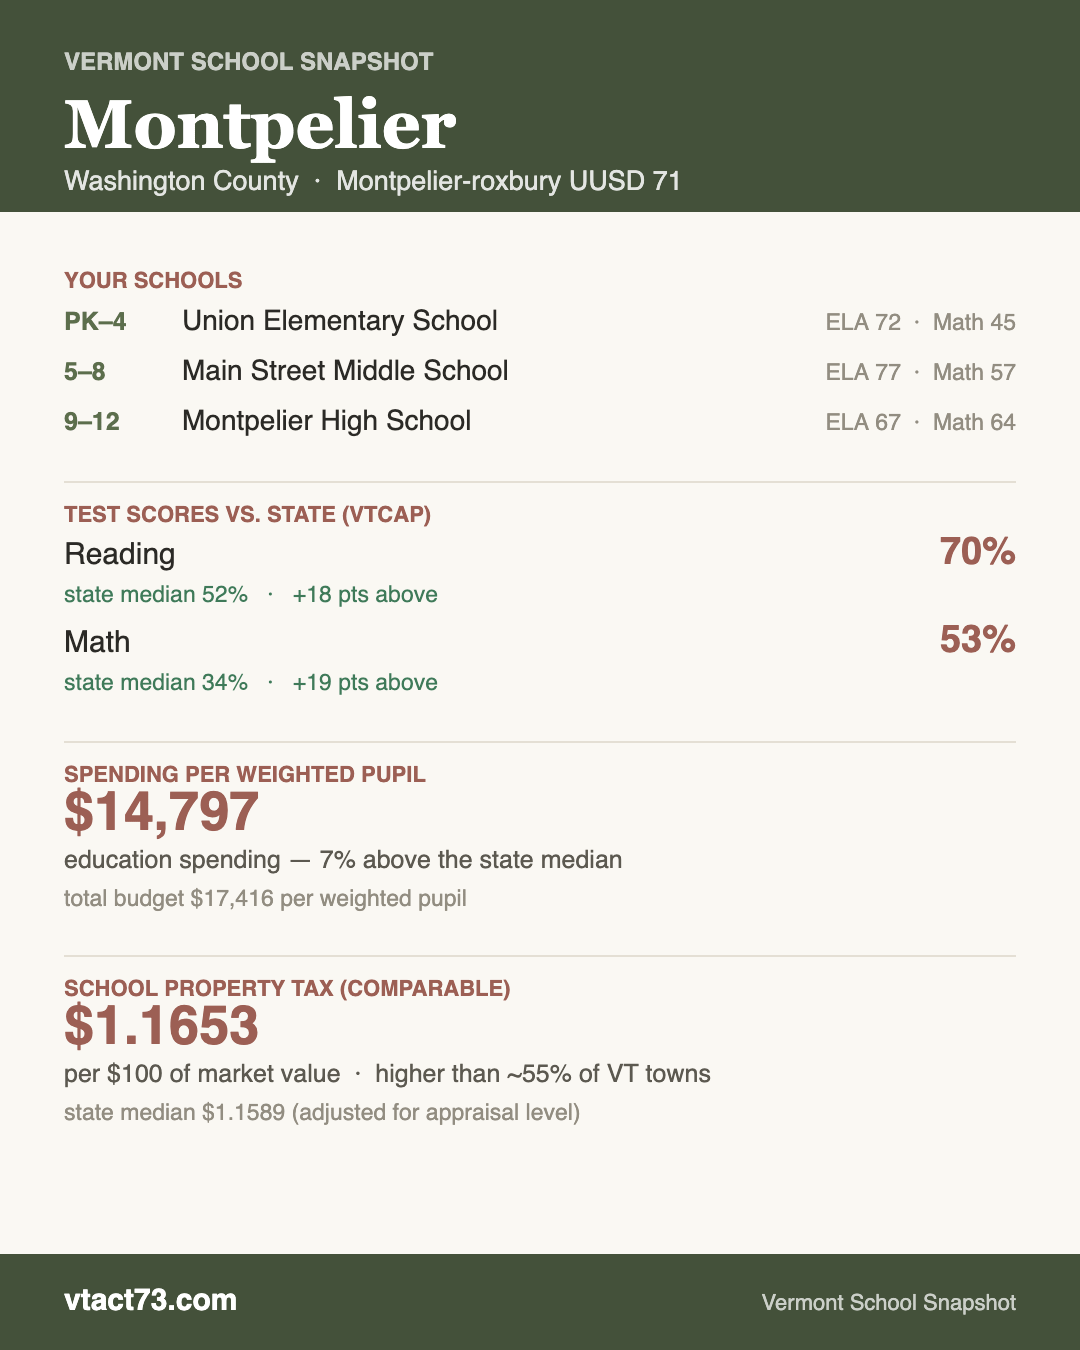
Everything above is a statewide story. But school reform doesn’t happen to “the state” — it happens to your town, your school, your tax bill. So I built a tool that brings the whole thing down to where you actually live. Type in your ZIP code and Your School Snapshot gives you a plain-language report for your town: the schools your children attend from prekindergarten through grade 12, their VTCAP test scores against the state median, how many students there are per teacher, your district’s enrollment and budget, what it spends per pupil compared to the rest of Vermont, your school property tax compared to other towns, where your district would stand under the coming foundation formula, and the merger timeline ahead. The dense stuff is tucked behind “show me more” toggles, so you can stay at the headline level or go as deep as you want.
I built it because abstraction is the enemy of engagement. “Vermont spends the second-most in the nation for middling results” is true, but it’s a statistic. “Your district spends $X per pupil, your kids score Y, and here’s what the new formula does to that” is a conversation. If this helps even a few families walk into a merger meeting or a Town Meeting Day vote actually understanding their own corner of the system, it did its job.
A note on the work behind it, because it turned out to be the hard part. There is no single file in Vermont that maps a ZIP code to a school, a district, a budget, and a tax rate — and in a state where dozens of towns operate no school of their own and tuition their kids elsewhere, a ZIP doesn’t even cleanly imply a school. So this is stitched together from a dozen official sources — the Agency of Education’s organization, enrollment, assessment, staffing, and per-pupil-spending datasets; the Department of Taxes’ rate tables; the legislature’s statutes and the JFO’s modeling; Census, NAEP, and NEA for national context — normalized into clean tables town by town. Because I think public data should be public, you can download the whole cleaned dataset as CSV or JSON right from the tool, and every source is linked. Check my work. Build on it. Tell me what I got wrong.
The honest caveats, in the spirit of the rest of this piece:
The foundation-formula comparison is directional — the base amount isn’t finalized and the JFO’s district map is superseded. It shows where your district stands today relative to the coming base, not a prediction.
Student-teacher ratios are from 2021, the latest the state publishes at the school level.
For tuition/choice towns, the tool tells you the grades that are choice but not always the specific destination school — confirm that with your district.
Test scores suppress very small groups, and a few small towns’ districts are matched by tax rate rather than a roster. Where I’m unsure, I say so.
And one last thing that was simply fun to make: every snapshot has a "create a shareable image" button that turns your town's numbers — schools, scores, spending, taxes, all relative to the state — into a clean card you can post or text to a neighbor, an educator, or your representative. Find your town, and if a number surprises you, send it to someone who can do something about it.
The Shape of the Retreat
Now the harder part of the analysis, offered in the spirit of the data, not of any team.
Vermont has been here before. Act 46, passed in 2015, was also a consolidation law built on voluntary mergers with incentives, deadlines, and an eventual state backstop. It took Vermont from 276 districts to 119. And the best available evidence says it did not bend the cost curve. A Yale analysis found no significant change in overall spending or tax rates. Vermont Public’s retrospective found merged districts saved about 6.5 percent on administration and then reallocated those savings into salaries and services rather than returning them. Governance changed. The money didn’t. And Act 46’s voluntary phase taught a lesson that should hang over every merger committee meeting this fall. The districts most in need of structural change were the least likely to volunteer for it, which is exactly why Act 46 ended in mandates for the holdouts.
Measured against that history, H.955’s consolidation mechanism is a retreat toward the model that already disappointed us. Voluntary committees, financial incentives, social pressure, and a holdout problem deferred to a future Legislature. The target shrank too. Act 73 aimed for districts of 4,000 to 8,000 students. H.955 aims for 2,000, which would land Vermont at perhaps 25 to 35 districts rather than 10 to 25. The consolidation research, for what it’s worth, finds the largest savings in merging the smallest districts, so 2,000 keeps Vermont inside the zone where savings are plausible, while capturing less of them.
Fairness requires two qualifications, and they matter.
The first is that H.955’s pressure system is meaningfully stronger than Act 46’s honor-system phase. Public naming, forfeited debt aid, a 45-point construction-aid gap, an orphan list. Whether it produces 2,000-student districts by March 2028 is an empirical question, but it is not fair to describe it as a simple rerun.
The second is the one that changes the stakes entirely. Act 46 changed governance and left the funding system untouched, and that is the most defensible explanation for why spending didn’t fall. Nothing about the funding architecture asked it to. H.955 carries the thing Act 46 never had, a formula that changes what spending decisions cost every town. That is the real difference between 2015 and 2026.
But notice what that does to the risk. The danger is no longer “consolidation without savings.” The danger is now a formula that only switches on if the 2027 Legislature delivers legislation addressing 7 topics, paired with consolidation pressure that only works if districts respond to money and reputation rather than mandate. And here a distinction I keep returning to matters more than any other in this debate. Funding is not cost. The formula’s modeled 6 percent reduction shrinks the bucket of money flowing to districts. It does not, by itself, shrink the cost of running 119 districts’ worth of structure. If the structure doesn’t consolidate, a smaller bucket doesn’t produce savings. It produces cuts, and the cuts land where the money is, which is to say in schools. The funding lever and the consolidation lever only work together. H.955 made one of them conditional and the other one optional.
We have run the experiment of changing the org chart without changing the money. We ran it for ten years. We named it Act 46.
The Layer We Added on the Way Out
Which brings me to the CESAs, the one structure in H.955 that appears nowhere in Act 73, and the part of this reform I find hardest to square with the evidence.
Start with what they are. Seven regional public corporations, written directly into statute, each with its own board, its own executive director, and its own staff, sitting between the supervisory unions and the state. Membership is mandatory for every supervisory union. Purchasing services is voluntary. They have no taxing power and no dedicated state aid stream. The state is spending about $1 million to stand them up, and the Joint Fiscal Office, asked what they will cost to operate each year, answered that the total fiscal impact is “currently unclear.”
The context that matters. Vermont already spends $1,451 per pupil on school administration against a national average of $818, nearly double, the direct price of running 119 districts and 52 supervisory unions for a student population the size of one mid-sized city. The response to a failed consolidation effort, in the state with nearly the highest administrative overhead in the country, was to add a new administrative layer. And we borrowed the model from New York, the one state that spends more per pupil than we do.
I went looking for the evidence that this model works, and I want to be careful about what I found, because the answer is not “evidence it fails.” The answer is closer to “no evidence at all.” Regional education service agencies have existed for 75 years in New York, 60 in Wisconsin, and there are roughly 553 of them across 45 states. In all that time, no rigorous independent study anywhere has shown that an ESA layer reduces total system costs or improves student outcomes. That is not my characterization. The national ESA trade association’s own literature review concedes the model is “among the least studied and comprehended” elements of K-12 education. Ohio’s state auditor tried to verify its agencies’ self-reported savings in 2020 and found the data “so inconsistent that no further analysis can be completed.” New York’s BOCES system, the direct template for ours, has produced 75 years of brochures and an audit record that includes $79 million in improper reserves and a restructuring that increased member districts’ administrative costs. Vermont’s own first entrant, the Vermont Learning Collaborative, reports a 66 percent savings on professional development, a figure that is self-reported, unaudited, and unaccompanied by any published budget.
Now the steelman, because there is one, and it happens to point at Vermont’s most genuine cost problem. The single credible cost finding in the entire national record comes from Massachusetts, where the state’s own education department found that regional collaboratives delivered intensive special education day programs at roughly $32,000 per pupil against $51,000 at private placements. Special education is among Vermont’s largest and fastest-growing cost drivers, and a small rural district genuinely cannot employ a full-time school psychologist or a low-incidence specialist alone. Buying a fraction of one through a regional entity is sound economics. If Vermont’s CESAs were scoped to exactly that, regional special education capacity and fractional specialist staffing, I would be writing a different section.
But that is not the role the legislation assigns them. CESAs arrived as the centerpiece of the consolidation alternative, carrying a savings narrative built on a Campaign for Vermont analysis that modeled roughly fifteen such agencies, not seven, using exactly the kind of self-reported savings figures the Ohio audit discredited, and whose own fine print warned that inefficiencies emerge at larger geographic scale. The honest way to say it is that CESAs were never the plan. The Governor’s January 2025 proposal was five districts large enough to provide their own services, no regional layer required. Act 73 softened that to 10 to 25. The task force refused the map. CESAs are the residue of a plan that lost, the price Vermont paid to keep the funding formula alive after mandatory consolidation died.
I’m not alone in this worry, and the company is notable. Education Secretary Zoie Saunders, in writing, before passage, warned that the CESA approach keeps all 119 districts and 52 supervisory unions “while adding” regional entities, each with its own board, director, and staff, “expanding, not reducing, administrative footprint.” Whether that warning lands depends entirely on the mergers. If consolidation succeeds, supervisory unions dissolve into a few dozen districts and the system genuinely simplifies. If the March 2028 votes underdeliver, Vermont could end end up with 119 districts plus 52 supervisory unions plus 7 new public corporations. Strictly more structure than today.
And there is no separate pocket paying for them. New York lubricates BOCES with over a billion dollars a year in dedicated state aid. Vermont’s CESAs run on membership fees and service charges drawn from the same capped pool of education dollars as everything else. If the layer costs more than it saves, the difference comes out of classrooms, out of the same dollar whose teacher-salary sliver is already thinner than the national average.
So here is my constructive ask, offered with the humility of someone who would be glad to be proven wrong. Build them narrow. Point them at special education, where the one real piece of evidence lives. And measure everything from day one, with baseline costs, published budgets, and independently verified savings, because in ten years an education fund under pressure is going to ask what seven executive directors and their staffs are delivering, and every state that couldn’t answer that question with numbers ended up arguing about testimonials. No state has ever launched this model with a real evaluation built in. Vermont could be the first, and H.955’s audit and reporting requirements are a start, if anyone enforces them like they mean it.
The Clock
Step back from the machinery, because the machinery is not the point.
Suppose everything goes right. The committees negotiate in good faith, voters approve sensible mergers in March 2028, the 2027 Legislature delivers all seven conditions on time, the formula switches on in July 2029, and the CESAs find real savings. Even then, what Vermont will have accomplished is a slower rate of increase in the cost of a system serving fewer and fewer children. The structural drivers are untouched. Enrollment is down 26 percent in two decades. We have the lowest birth rate in the country and one of the oldest populations, and property tax bills have risen more than 40 percent in five years. Young families do the math on housing, taxes, health insurance, and childcare, and increasingly the math says no. Fewer families means fewer students, which raises per-pupil costs, which raises taxes, which prices out more families. I’ve called it a flywheel before, and nothing passed this session stops it. That is not a criticism of H.955, which is an education bill, not an economic development strategy. It is a reminder of where education reform sits in a much larger problem of demographics, opportunity, and affordability.
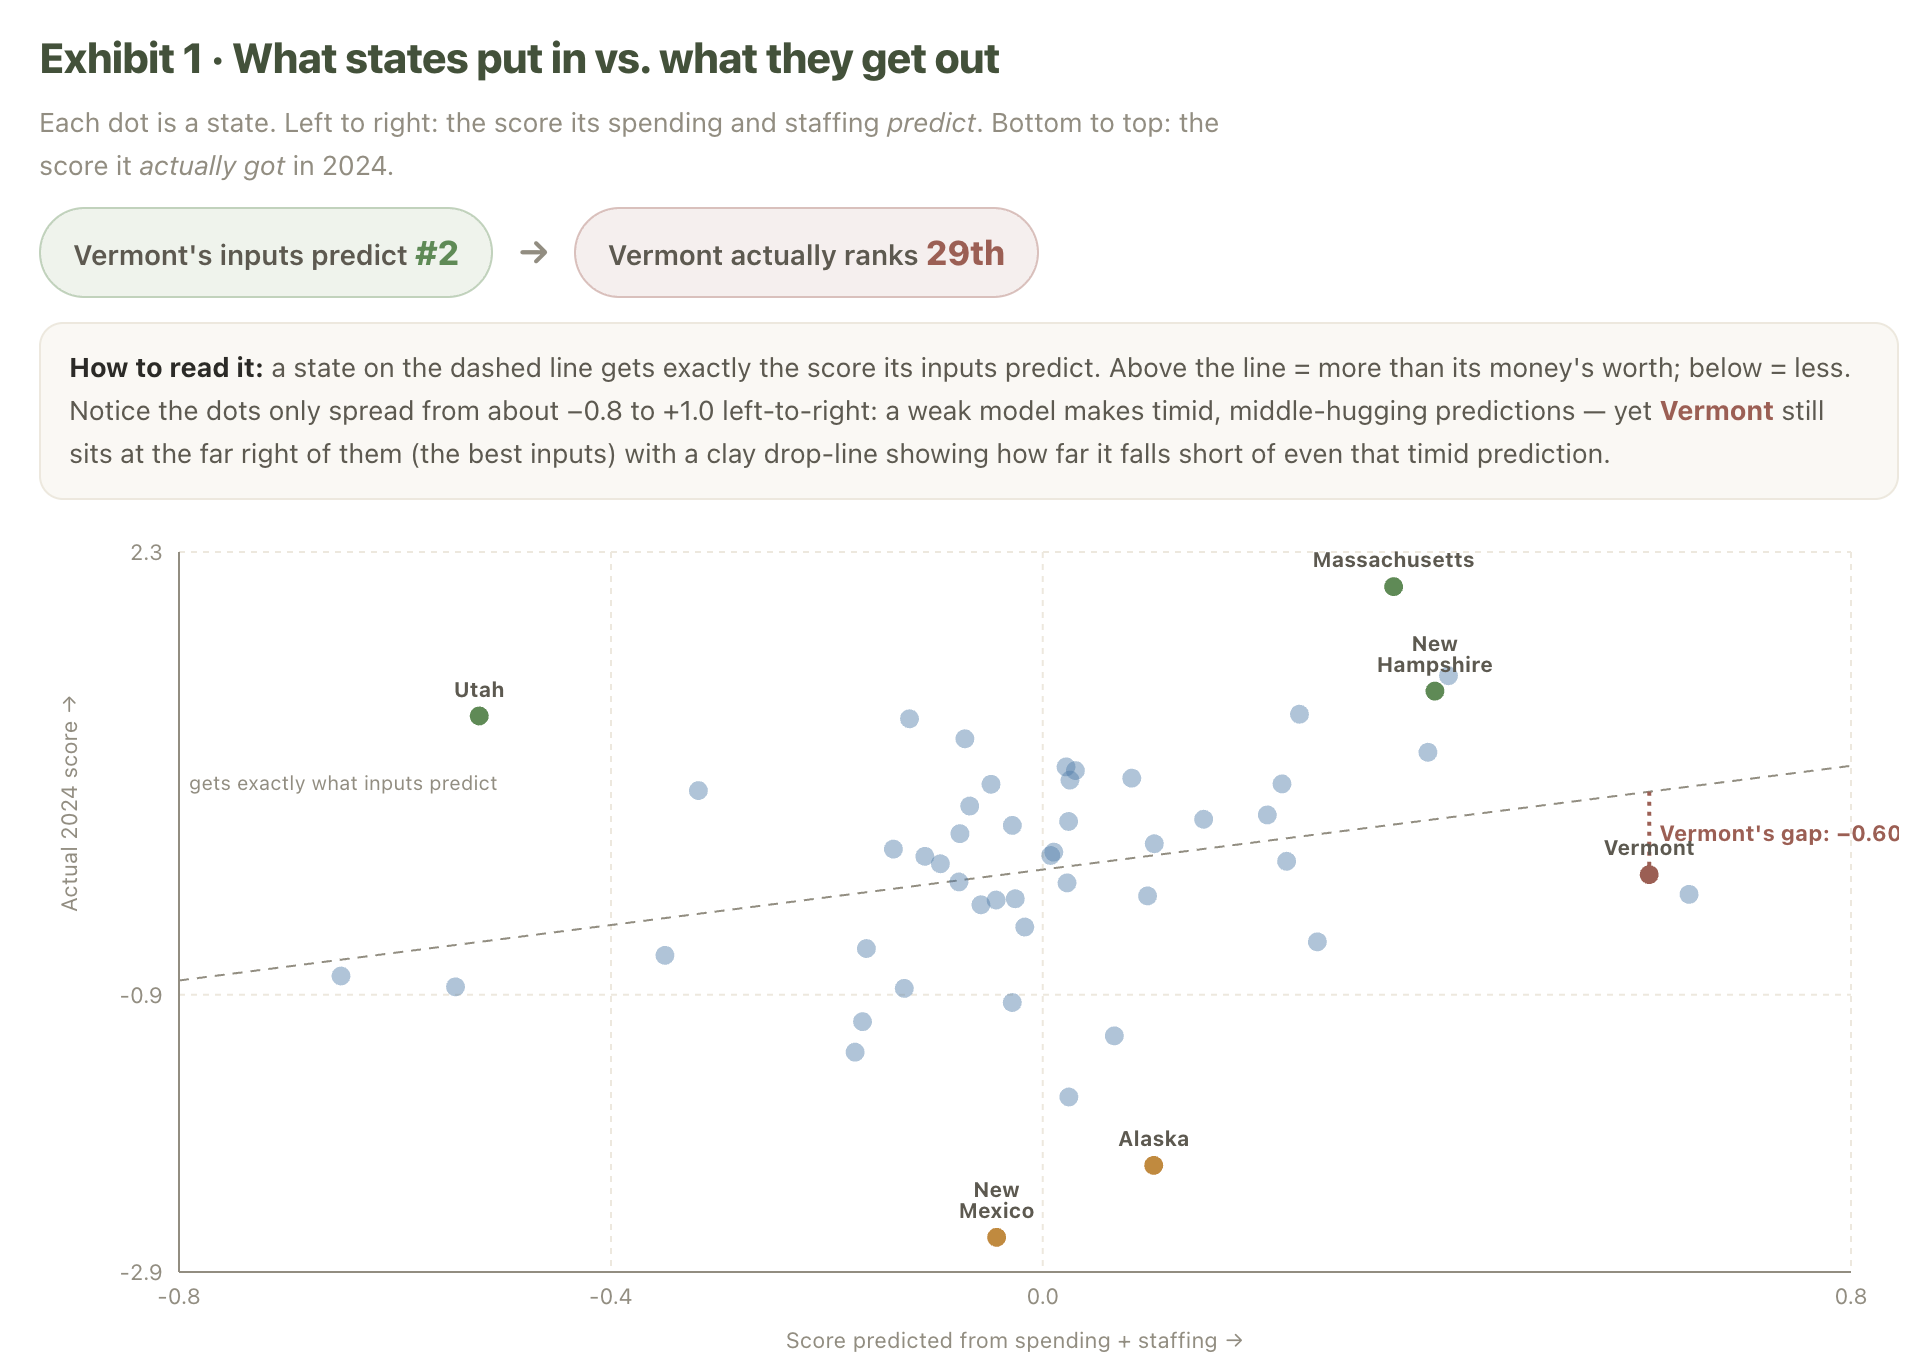
It’s also why I keep pressing on the relationship between what we spend and what we get. The new money vs. results page on the dashboard looks at all fifty states and asks how much of the difference in test scores you can predict from per-pupil spending and student-teacher ratios. The answer is less than a tenth, and even that mostly evaporates once you account for the Northeast being simultaneously the highest-spending and most demographically advantaged region. I want to be careful with this finding, because its statistical weakness is the point, not a flaw to hide. It does not say spending doesn’t matter. The experimental research is clear that targeted investments, like serious class-size reductions for disadvantaged students, produce real gains, and Vermont is already far past those margins. What the analysis does support is narrower and, for us, more uncomfortable. If inputs predicted outcomes, Vermont’s inputs, nearly the highest spending in the nation and the most teachers per student, would predict the second-best results in America. Vermont ranks 29th. Almost no state gets less for what it puts in. New Hampshire, with a statistically identical staffing ratio and about $6,800 less per student, outscores us on all four NAEP tests.
Let me head off the obvious misreading, because this is where I want to be unmistakably clear. If there is anything I am willing, even glad, to spend more on to get better results, it is my children’s education. Nobody should walk away from this piece thinking I’d trade a school for a solar panel. The problem is not that Vermont invests in education. The problem is that we spend the second most in the nation for average results, while states that look a lot like us in many of the ways that matter get better results for less. The reasons are structural, historic, personal, and cultural, and none of them, alone or together, is easy to fix. But if we can be honest that some not-insignificant share of our spending is not directly buying better outcomes for kids, then it becomes worth asking, as a thought experiment, what else those dollars could do. The gap between Vermont’s per-pupil spending and the national average is about $11,199 per student, north of $800 million a year in aggregate. That sum could fund roughly 1,500 new homes every year (or 247 pints of Ben & Jerry’s for every vermonter!), about half the state’s entire 2025 to 2029 housing target, each one a landing spot for a young family that fills a classroom and pays the taxes that support it. The same dollars attacking the same problem, from the other side of the flywheel. I built a small interactive version of this on the dashboard, what the extra spending could buy, where you can drag a slider and see the gap in tangible terms. It’s a thought experiment about scale, not a budget proposal, and it deserves a fuller piece of its own, which I’m working on. I raise it here for one reason. It is what “structural problem” means in dollars.

“If there is anything I am willing, even glad, to spend more on to get better results, it is my children’s education.”
Which brings me to the conclusion this whole year has been building toward. Every individual concession in the journey from Act 73 to H.955 sounded reasonable in the room where it was made. Respect local control. Give the process time. Finish the formula’s design before launch. Stand up shared services so small districts aren’t stranded. I mean it when I say each argument has merit, and I’ve tried to present each one fairly. But concessions accumulate, and at some point you have to put the original promise and the current plan side by side and look.
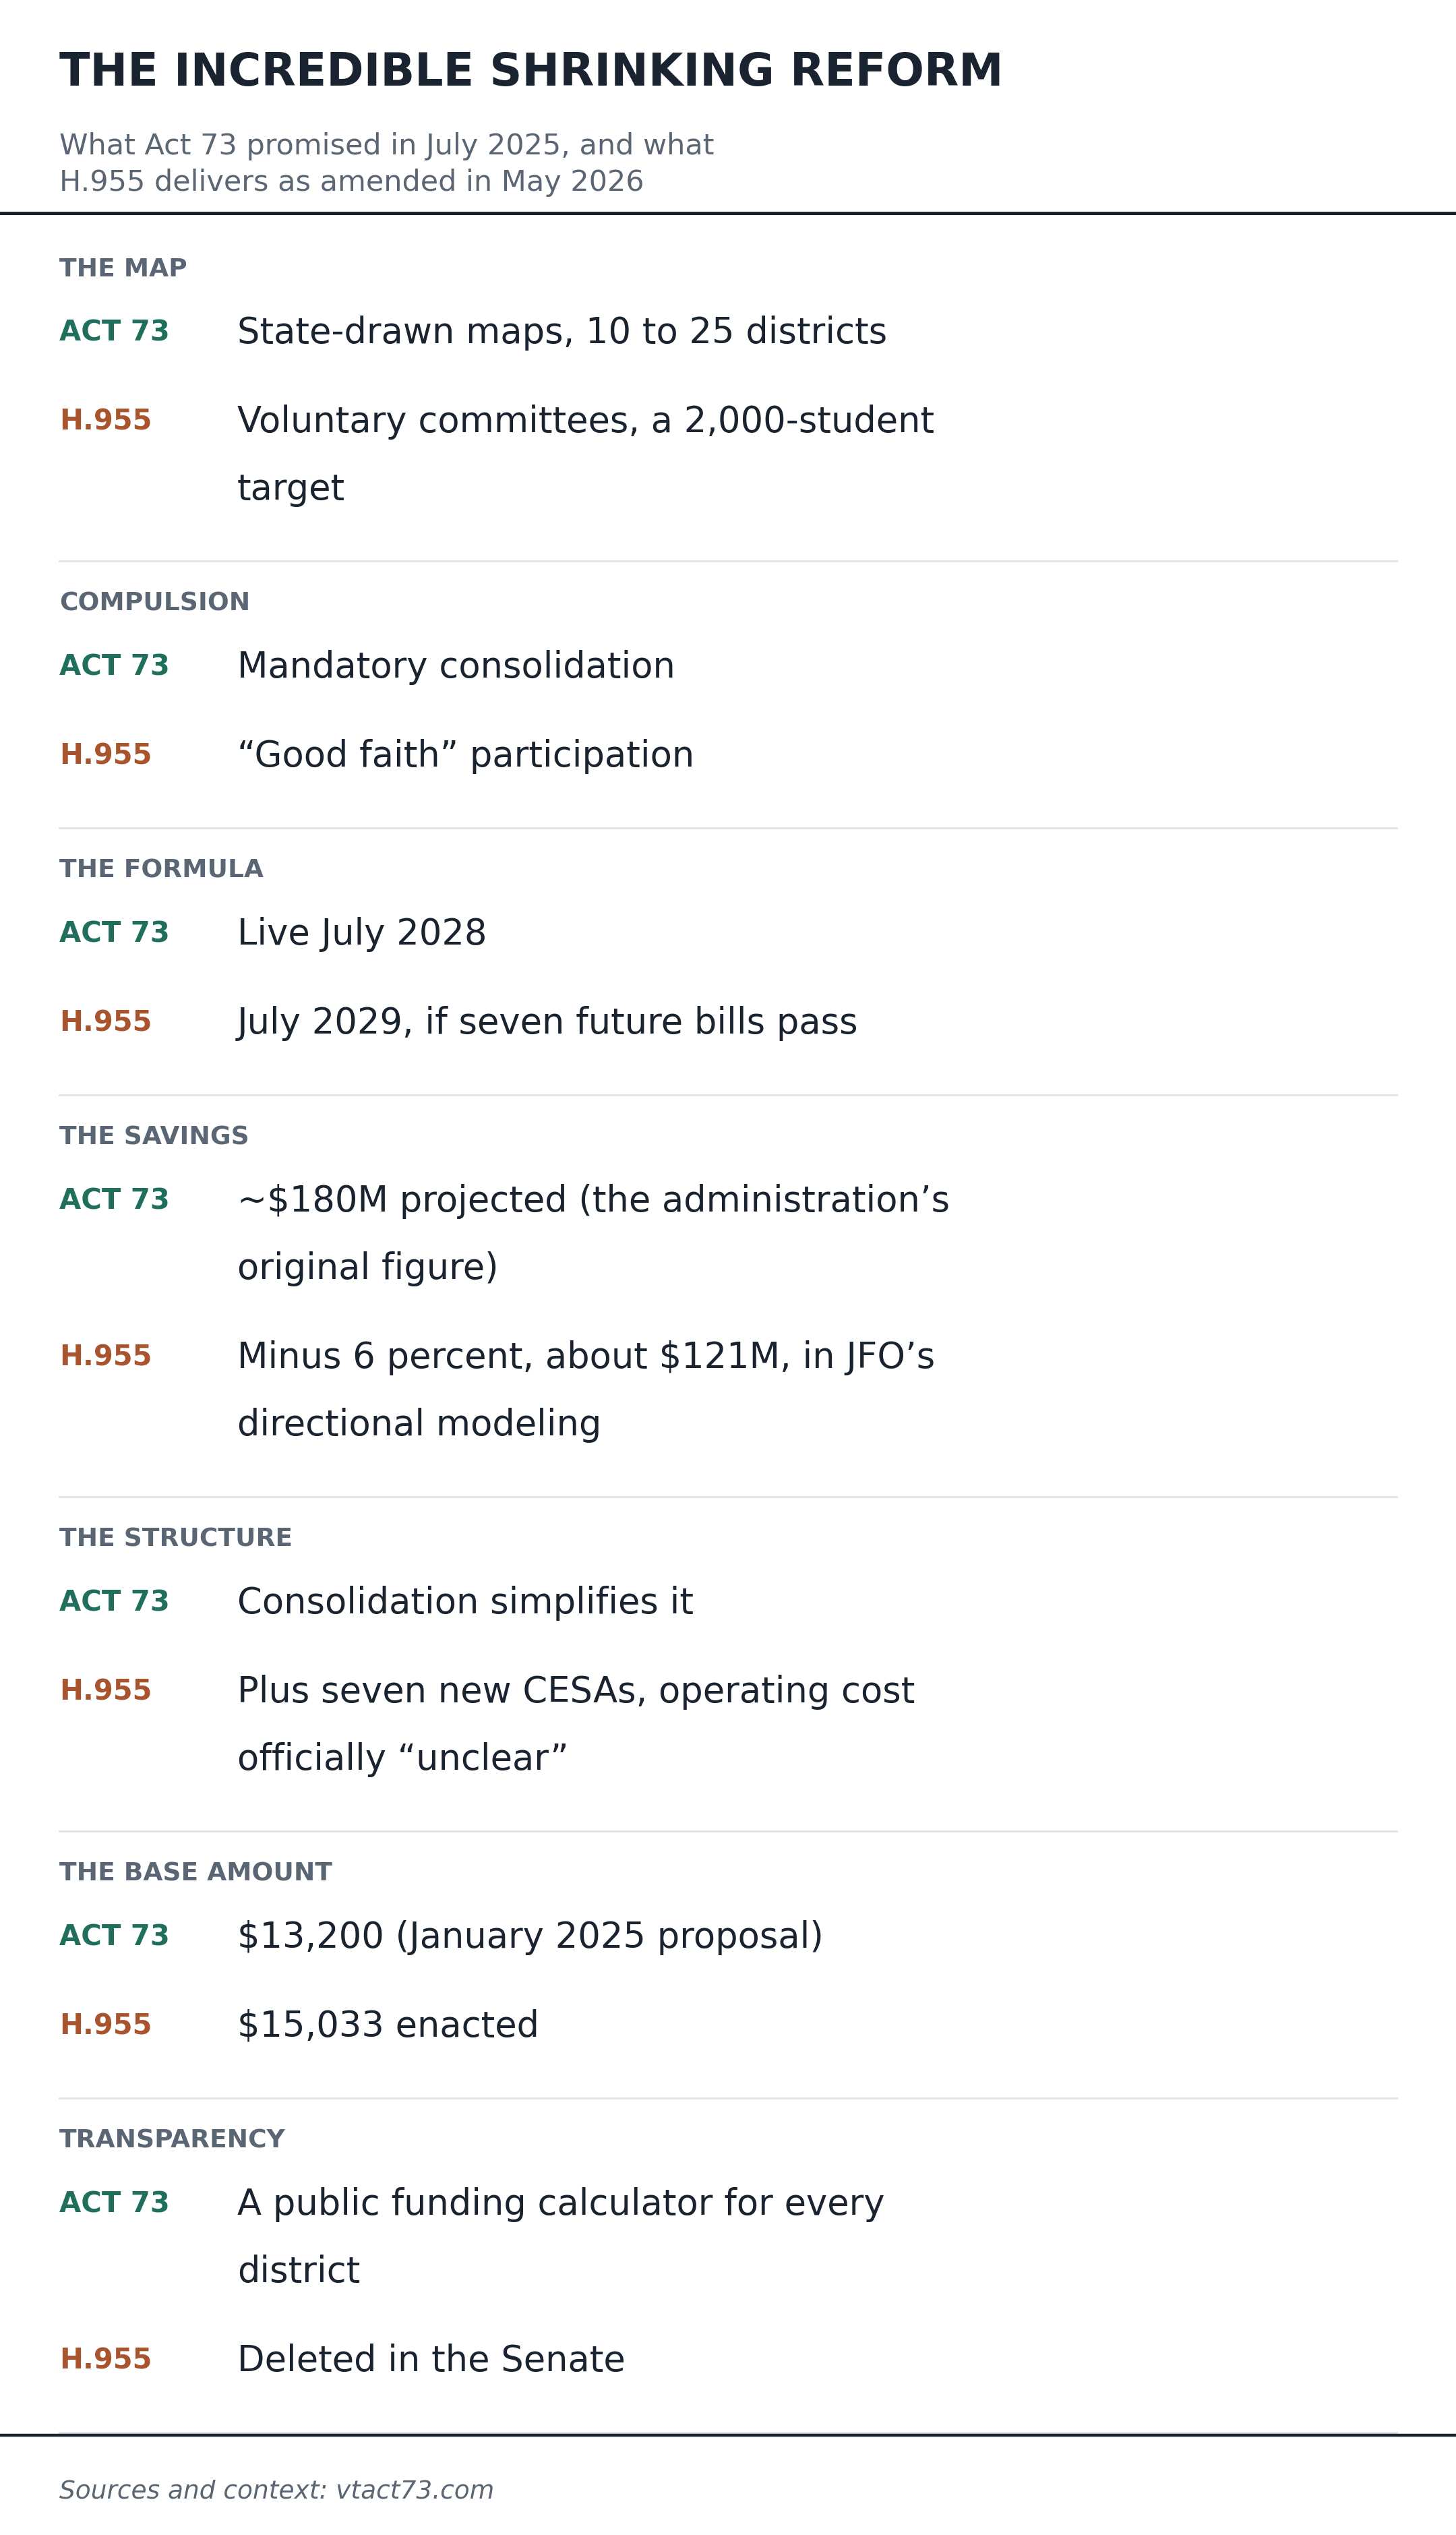
Each row was a reasonable concession.
In fairness, the ledger is not entirely one-directional. The final bill’s pressure tools are stronger than anything in Act 46, the conference restored most of the class-size enforcement the Senate had paused, and the conditions on the formula, if the Legislature actually meets them, will produce a better-designed formula than the one Act 73 enacted. The claw-backs are real, and so are the repairs. My worry is the net. A reform that started as the most ambitious restructuring in a generation now depends on voluntary votes, future legislation, and a brand-new administrative layer with no evidentiary track record, in a state that needed the original ambition. Each fork in the road, we chose the slower, smaller, less certain path. The accumulated result is a reform that nets out to less than the moment demands, on a clock we can’t afford.
What Happens Next
The next two years have actual dates attached, and they are worth knowing, because several of them are moments where ordinary Vermonters hold the pen.

This fall, the state hires merger facilitators by September 1, and merger committees are seated by October 15. That is the first test of what “good faith” means in practice, and those meetings are public. Through 2027, the Legislature must pass the legislation the formula is conditioned on, which makes the 2027 session the hinge of the entire reform. Committee reports are due September 1, 2027. And on March 7, 2028, Town Meeting Day, Vermonters vote on the mergers themselves. If conditions are met, the formula and the new statewide tax structure go live July 1, 2029. The dashboard’s What’s next page walks all of it, step by step, updated as things move.
I’d be remiss not to note what is still missing from every version of every plan. Norwich and the interstate districts, Dresden and Rivendell, appear in no merger group on any map produced at any point in this process. The question that produced the minus 34 percent figure that started me down this road months ago, how the first interstate school district in America fits into a statewide foundation formula, remains exactly as unresolved today as it was then. Someone has to decide. Nobody has.
I’ll end where I always end, because it’s the truth. I love this state. I love Norwich, and I love Marion Cross, and our daughters are surrounded there by teachers who deserve more than the sliver of the education dollar that reaches them. That sliver is the quiet thread of this whole story. We built and kept a structure so large that the people and purposes at its center get a smaller share of each dollar than they deserve, and the reform meant to fix it keeps getting smaller while the structure does not. Reasonable people disagreed all year about mandates and local control, and the compromise that emerged reflects real democratic constraints, not bad faith. But the honesty and urgency this moment needs, has left me unsatisfied.
So here is the ask. Show up to your merger committee’s meetings this fall. Watch what the 2027 Legislature does with the seven conditions, because that’s where this reform quietly succeeds or quietly dies. Vote in March 2028 knowing what you’re voting on. And if it helps, use vtact73.com to understand the system before you do. I built it for my own town. I rebuilt it for the whole state, because every Vermonter deserves to understand this in plain English, and because the conversation is too important for any of us to sit out.
Sources
Legislation and official documents
Act 73 as enacted (July 2025)
H.955 bill status and texts, Vermont General Assembly
Redistricting Task Force Legislative Report (December 2025)
JFO, Estimated Act 73 Foundation Formula Impacts (draft, February 2026)
JFO, fiscal note on H.955 as passed by the House and Senate (June 8, 2026), on CESA costs and savings (”currently unclear”)
Governor Scott, 2026 bill actions
Coverage of the 2026 session
VTDigger, Vermont Legislature passes landmark education reform without forcing districts to merge (May 29, 2026)
VTDigger, Legislature adjourns 2026 session (May 29, 2026)
Valley News / VTDigger, Vermont’s H.955 education bill: a new reform era (June 3, 2026)
Vermont Public, With a deal on education reform in hand, lawmakers close out the session (May 29, 2026)
Act 46 and consolidation research
Vermont Public, Did Act 46 work? It’s complicated (September 2024)
Duncombe & Yinger, Does School District Consolidation Cut Costs? (Syracuse University, 2007)
CESAs and education service agencies
Vermont Act 168 (2024), authorizing BOCES-style entities
Secretary Zoie Saunders, November 2025 letter on the task force proposal (via VTDigger, November 28, 2025)
Massachusetts DESE, Special Education Placements and Costs in Massachusetts (2009)
Ohio Auditor of State, Educational Service Centers Operational Study (2020), pp. 31–32, “we were unable to determine the accuracy of the applications and the reported savings” and “so inconsistent between ESCs that no further analysis can be completed”
New York State Comptroller, BOCES audits (2010, 2017, 2025)
Association of Educational Service Agencies, Educational Service Agencies: Review of Selected/Related Literature (June 2021), “among the least studied and comprehended element of K-12 public education”
Campaign for Vermont, Finding Savings Through Shared Services in Vermont Schools (November 2025), the ~$300M estimate modeled at 15 CESAs
Campaign for Vermont, action alert on H.955 (April 16, 2026), seven CESAs are “double what we had recommended” and at ~1,380 sq mi “inefficiencies start to emerge”
Spending, outcomes, and demographics
U.S. Census Bureau, Annual Survey of School System Finances (FY2024)
NAEP state profiles (2024), verified against the NCES NAEP Data Service
NEA, Rankings of the States 2024 & Estimates of School Statistics 2025
Urban Institute, States’ Demographically Adjusted Performance on the 2024 National Assessment
NCES Table 236.75, school administration spending by state
Vermont Housing Finance Agency, Housing Needs Assessment 2025–2029
The 50-state inputs-and-outcomes analysis is documented, with its full methodology and limitations, at vtact73.com/#/money-vs-results
Prior pieces
Thanks for another great post and the detailed analysis you have done. I have two concerns that you have not mentioned.
1. When districts do merge, if their teachers and staff are covered by different contracts, it is hard to see how how the union will accept the contract with a lower salary structure over the higher structure. So teacher salaries and benefits will be leveled up to the higher salary structure (and benefits). Since salaries and benefits are by far the biggest share of school spending, that will increase spending and reduce (or eliminate?) any savings due to whatever mergers happen.
2. In 1997, the state used a foundation formula to distribute school aid. The Brigham decision found that unconstitutional. My guess is that someone will challenge a new state aid system based on a foundation formula. Will the state Supreme Court overturn Brigham and throw this entire reform agenda, or at least parts of it, out the window? And remember that in 1997 Vermont spent about 20% more than the national average per student. One unintended (?) consequence of Act 60 is that our spending rose to about 65% more than the US average.