What the Data Actually Says About Vermont's Education Reform Options
A response to Rep. Jim Masland on H.955, CESAs, and the urgency of the moment

One of my local representatives, Jim Masland, recently shared his perspective on education reform with our community listserv. I appreciate his engagement and his long service to Norwich, Thetford, Sharon, and Strafford. His note raises important questions about the path forward, and I want to add some data and context that I think can help sharpen the conversation, because precision matters in a debate with consequences this significant.
For those just joining this conversation, I’ve spent the past several months building an interactive data dashboard at vtact73.com that visualizes Vermont’s education spending, demographics, test scores, and the legislative history of reform attempts. I published a detailed companion analysis here on Substack. I’m not an education policy expert. I’m a Norwich parent with a background in data and technology who started pulling at these threads after seeing the Joint Fiscal Office’s preliminary -34% funding cut for our district and couldn’t stop.
The Starting Point: Where We Actually Are
Before debating governance models, I think we need a shared understanding of the facts. These are not opinions. They are published data from federal and state sources, all visualized on the dashboard for anyone to examine.
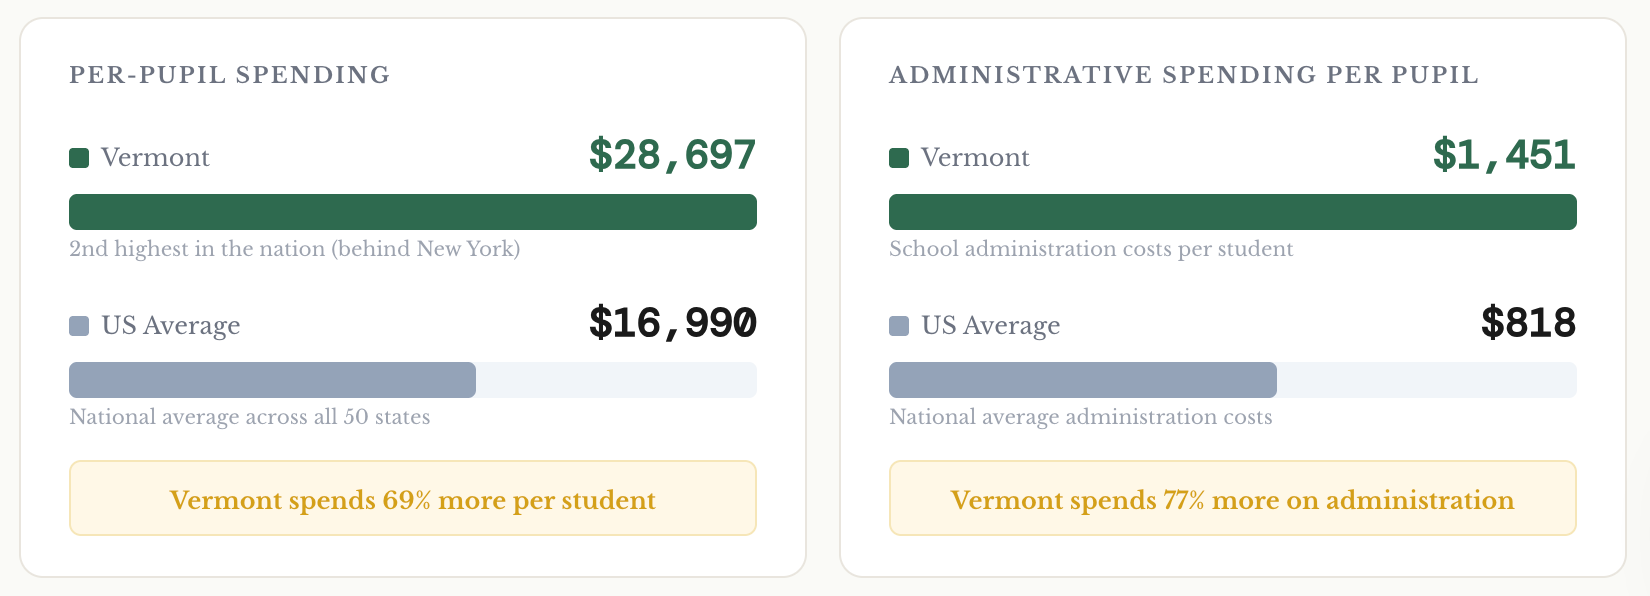
Spending. Vermont spends more per pupil than every state except New York. According to the NEA’s Rankings & Estimates 2025, we spend $28,697 per student, roughly 69% above the national average of $16,990. Our administrative spending, at $1,451 per pupil, is nearly double the $818 national average (NCES Table 236.75). That $633 per pupil gap, applied across roughly 69,000 K-12 students, represents approximately $44 million per year in excess administrative overhead. We maintain 119 school districts and 52 supervisory unions to serve those students.
Teacher pay. Our average teacher salary of $69,562 ranks 17th nationally and falls below the $72,030 national average. The money is not going disproportionately to the people in the classroom.
Outcomes. On the 2024 NAEP, Vermont’s 8th grade reading scores fell below the national average for the first time in the history of the assessment. The decline from 2019 to 2024 was the steepest of any state. Fourth grade scores in both math and reading have fallen to or below national averages. When the Urban Institute adjusts for demographics (Vermont has among the lowest child poverty rates in the nation), our performance ranks among the worst in the country.

Examining the Claims
Rep. Masland’s note frames the education debate primarily as a governance question: forced consolidation vs. voluntary Cooperative Educational Service Areas, or CESAs. He makes several specific claims that I think deserve a closer look alongside the available evidence.
On the claim that “study after study” firmly establishes consolidation increases costs.
I’d be genuinely interested to see the specific studies referenced here, because the picture I’ve found in the peer-reviewed literature is more complicated than that framing suggests.
A landmark study by Duncombe and Yinger at Syracuse University found that consolidation “substantially lowers operating costs, particularly when small districts are combined,” with savings ranging from 22% for two 300-pupil districts to 8% for two 1,500-pupil districts. A study of North Carolina school district consolidation published in Economics of Education Review found that mergers led to decreased per-pupil expenditures on instruction and district support services without negatively affecting students. A Ball State University analysis of New Jersey and surrounding states found savings of roughly $3.7 million per county from reducing districts by one. A Kansas Legislature study found that per-pupil costs decline significantly as enrollment increases among small districts, with the lowest costs at around 1,500 students.
The research does show diminishing returns as district size grows, and the meta-analysis literature notes that merging already-large districts can produce diseconomies. But Vermont’s situation is not one of large districts. We have 119 districts averaging roughly 580 students each, with many far smaller. We are squarely in the range where the literature consistently finds consolidation savings.
What the Yale thesis on Act 46 showed was not that consolidation can’t save money. It’s that consolidation without a concurrent change to the funding formula didn’t produce overall spending reductions in Vermont. Act 46 merged governance but left the spending incentives unchanged. Act 73 proposes both simultaneously, a meaningfully different intervention. Dismissing Act 73’s potential based on Act 46’s limitations is comparing apples to oranges.
On the claim that CESAs have “a proven track of savings and educational success.”
Vermont’s first CESA, the Vermont Learning Collaborative, was formed less than a year ago. I genuinely hope it succeeds. But I think it’s worth being precise about language here. Characterizing CESAs as “proven” in Vermont gets ahead of the evidence. And Campaign for Vermont’s own analysis estimated that the $300 million in potential shared-services savings they identified would require roughly 15 CESAs, not the seven proposed in H.955, noting that at the larger geographic scale (averaging nearly 1,380 square miles each), “inefficiencies start to emerge.”
On the claim that voluntary cooperation produces “universally positive” results.
Voluntary cooperation is appealing, and I understand the instinct. But I think it’s worth noting a well-documented challenge with voluntary approaches: the communities most in need of structural change are often the least likely to volunteer for it. This is what happened during Act 46’s voluntary phase, which is why the legislature ultimately mandated mergers for holdouts.
The Broader Context
I’d like to add some context that I think is essential to this conversation but falls outside the scope of Jim’s note. The governance question matters, but it sits inside a much larger picture of fiscal sustainability, demographic decline, and competitive position that I think we need to confront together.
Vermont ranks 42nd in tax competitiveness (Tax Foundation 2026). We have the highest property tax burden in the nation as a share of income (WalletHub). Home values have grown roughly three and a half times faster than incomes over the past five years. We are the 3rd oldest state with the lowest birth rate, and K-12 enrollment has fallen 26% in two decades while national enrollment has been essentially flat.
A Wall Street Journal analysis published this month shows Vermont with -1.7% private sector job growth (excluding healthcare) from January 2020 to January 2026, drawing on Bureau of Labor Statistics data. That places us among the worst-performing states in the country alongside Oregon, Hawaii, California, and New York, all high-tax states. Meanwhile, lower-tax states are surging. Texas added 10%, Florida 8.5%, and even our neighbor New Hampshire, with no income tax, grew 1.6%. New Hampshire isn’t outperforming Vermont because it has more sunshine.

As I’ve written previously, this creates a demographic flywheel spinning in the wrong direction. “Vermont is pricing out the very people whose presence would ease the fiscal pressure on our schools, our tax base, and our communities.” No governance model, whether forced mergers or voluntary CESAs, addresses this unless we also tackle the affordability crisis that’s driving it.
Two Parallel Problems, Not One
I want to be careful here not to conflate two issues that are related but distinct.
The first is about funding, governance, demographics, and broad affordability. That’s the consolidation debate. Can we reduce the administrative overhead of 119 districts for 69,000 students and make the state more fiscally sustainable? The peer-reviewed evidence on consolidation and cost savings is reasonably clear, as I’ve outlined above.
The second is about educational attainment and outcomes. And here, the research tells a different story. The studies I can find looking at consolidation’s impact on student achievement consistently indicate null to slightly positive effects. McGee, Mills, and Goldstein (2023) used a rigorous regression discontinuity model to study Arkansas’s mandatory consolidation and found “either null or small positive impacts on student achievement in math and English Language Arts.” A Dutch study by de Haan, Leuven, and Oosterbeek (2016), published in The Journal of Law, Economics, and Organization, found a small positive effect of 0.72% of a standard deviation. The North Carolina study by Schurrer (2023) found that consolidation reduced per-pupil costs without negatively affecting educational attainment. Berry and West (2010), in a widely cited study of the massive 1930-1970 consolidation wave, found that district consolidation was associated with modestly higher educational attainment, though school consolidation (making individual schools larger) had negative effects. Act 73 proposes the former, not the latter. Schools would stay open.
The bottom line is consolidation doesn’t appear to harm students, but it doesn’t meaningfully improve outcomes either. It’s a cost-efficiency intervention, not an educational quality intervention. Which means that even if we get the governance and funding questions exactly right, we still haven’t addressed the outcome crisis. Vermont’s 8th grade reading scores didn’t fall to the bottom because we have 119 districts instead of 25. They fell because of what’s happening (or not happening) in instruction and curriculum.
That brings me to what I think is the most underappreciated part of this conversation.
What Spending Alone Can’t Tell Us
I want to acknowledge that spending, spreadsheets, and dashboards don’t tell us everything in isolation. I’ve been learning a great deal recently about what’s been called the “Mississippi Miracle,” and I think it carries a lesson Vermont urgently needs to hear.
In 2013, Mississippi ranked 49th in the nation for fourth grade reading. By 2024, it had climbed to 9th. Louisiana rose from 42nd to 11th. They did this while spending 45-58% less per pupil than Vermont.
What did they do? Mississippi invested $15 million to train 8,000 teachers in evidence-based reading instruction. They placed 60 literacy coaches in the lowest-performing schools. They adopted the “science of reading” across their curricula and held students accountable with clear reading benchmarks before advancing to the next grade. Louisiana implemented similar reforms through the Steve Carter Literacy Program. These weren’t governance reforms or funding formula changes. They were instructional reforms, focused on what actually happens in the classroom.
I have more to learn about what these states did and how transferable their approaches are to Vermont. But the lesson seems clear enough. The path to better outcomes may not run primarily through governance restructuring and funding formulas, but through what we teach, how we teach it, and how seriously we hold ourselves accountable for results. Vermont should be looking carefully at these examples. When states with twice our poverty rate and half our spending are producing better demographically-adjusted outcomes, the problem is not that we need to spend more or study more maps. It’s that we need to fundamentally rethink our approach to instruction and accountability.
The Urgency of Now
I am not dogmatic about whether the right answer is Act 73, H.955, CESAs, or something else entirely. I welcome that debate.
What I am dogmatic about is the status quo, and the urgency of addressing it. Vermont has made no fewer than four major legislative attempts to bend the education cost curve in a single decade.
Acts 153 & 156 (voluntary Regional Education Districts, 2010/12)
Act 46 (governance consolidation, 2015)
Act 173 (special education reform, 2018)
Act 127 (pupil reweighting, 2022)
Each addressed a piece of the system within the existing framework. Each, by the available evidence, fell short of its promises. Act 73 intends to be a more comprehensive approach combining consolidation with dramatic changes to the funding formula. And now H.955 would delay the foundation formula from 2028 to 2030, while the Senate considers inflating the base amount permanently higher before it even takes effect.
Every year we delay is another year of the highest per-pupil spending in the country producing below-average results. Another year of property tax bills that push young families away. Another year the demographic spiral tightens. I fear we’re reaching a point where the compounding costs of inaction will outpace our ability to course-correct. The children in our schools right now, and the families that will never move here because the math doesn’t work, don’t have the luxury of another four-year study committee.
As I’ve said before, “I think it’s at least worth considering whether piecemeal reforms within the existing architecture have reached the limits of what they can achieve, and whether a more ambitious rethinking is warranted.” I think all of us, legislators and citizens alike, owe each other an honest reckoning on this, grounded in evidence and conducted with urgency commensurate with the scale of the problem.
I’d encourage anyone interested to explore the dashboard at vtact73.com and draw their own conclusions. I welcome pushback, corrections, and context I've missed. All I'd ask is that we bring evidence with us. There's a human tendency to dig in when the data challenges our priors, and I'm not immune to it. But the stakes here, our children's outcomes, the fiscal trajectory of this state, whether young families can afford to build a life in Vermont, are too high for any of us to treat this as a contest of conviction over facts.
Sources & Citations
Vermont spending and administrative costs
NEA Rankings & Estimates 2025. Vermont per-pupil spending: $28,697; national average: $16,990; Vermont average teacher salary: $69,562; national average: $72,030. nea.org/resource-library/educator-pay-and-student-spending-how-does-your-state-rank
NCES Table 236.75, School Year 2020-21. Vermont school administration spending: $1,451/pupil; national average: $818/pupil. nces.ed.gov/programs/digest/d23/tables/dt23_236.75.asp
Vermont enrollment
Vermont Agency of Education enrollment data (October 1 counts, K-12 only): 93,565 (SY 2003-04) to 69,289 (SY 2024-25). education.vermont.gov/data-and-reporting
NCES Common Core of Data Table 2, SY 2023-24: Vermont student membership 82,455 (PreK-12). nces.ed.gov/ccd/tables/202324_summary_2.asp
NAEP test scores
National Assessment of Educational Progress, 2024 results. Vermont 8th grade reading: 257 (down from 271 in 2019; steepest decline of any state). Vermont 4th grade math and reading at or below national averages. nationsreportcard.gov
Urban Institute, demographically adjusted NAEP scores (2024): Vermont among the lowest-performing states after controlling for poverty, race, and other demographics. urban.org/research/publication/states-demographically-adjusted-performance-2024-national-assessment
Tax burden and affordability
Tax Foundation, 2026 State Business Tax Climate Index: Vermont ranks 42nd. taxfoundation.org/location/vermont
WalletHub, Property Tax by State (2025): Vermont has the highest property tax burden as a share of income. wallethub.com/edu/states-with-the-highest-and-lowest-property-taxes
Wall Street Journal, “The Growing State Tax and Jobs Divide,” April 15, 2026 (Bureau of Labor Statistics data): Vermont private job growth -1.7% from January 2020 to January 2026. wsj.com/opinion/progressive-states-taxes-jobs-business-8e3d507b
School district consolidation research
Duncombe, William and John Yinger. “Does School District Consolidation Cut Costs?” Syracuse University Center for Policy Research, 2007. Findings: consolidation substantially lowers operating costs for small districts (22% savings for 300-pupil districts; 8% for 1,500-pupil districts). surface.syr.edu/cpr/122
Schurrer, Clint A. “School district consolidation in North Carolina: Impacts on school composition and finance, crime outcomes, and educational attainment.” Economics of Education Review, 2023. Findings: consolidation reduced per-pupil expenditures without negatively affecting students. doi.org/10.1016/j.econedurev.2023.102405
Faulk, Dagney and Michael Hicks. “School District Consolidation” (Ball State University / NJ Realtors analysis). Findings: $3.7 million average county savings from reducing districts by one. njrealtor.com/wp-content/uploads/2016/12/SCHOOL-DISTRICT-CONSOLIDATION-FINAL.pdf
Taylor, Lori et al. Kansas Legislature cost study, 2018. Findings: per-pupil costs decline significantly as enrollment increases among small districts; lowest costs at ~1,500 students. (Referenced in Delaware cost study, solutionsfordelawareschools.com)
Andrews, Matthew et al. “Potential cost savings from school district consolidation: A case study of New York.” Economics of Education Review, 2002. Findings: sizeable cost savings from consolidation of districts with fewer than 500 pupils. doi.org/10.1016/S0272-7757(00)00011-8
Yale University thesis on Act 46 consolidation outcomes. Findings: no significant change in overall spending or tax rates. campaignforvermont.org/yale_report
Consolidation and student achievement
McGee, Josh B., Jonathan N. Mills, and Jessica S. Goldstein. “The Effect of School District Consolidation on Student Achievement: Evidence from Arkansas.” Educational Evaluation and Policy Analysis, 2023. Findings: null or small positive impacts on math and ELA achievement. journals.sagepub.com/doi/abs/10.3102/01623737221133394
de Haan, Monique, Edwin Leuven, and Hessel Oosterbeek. “School Consolidation and Student Achievement.” The Journal of Law, Economics, and Organization, 2016. Findings: small positive effect on achievement (0.72% of a standard deviation); reduced competition did not harm outcomes. academic.oup.com/jleo/article-abstract/32/4/816/2503116
Schurrer, Clint A. (2023), referenced above. Additional finding: no negative effects on educational attainment or long-term youth outcomes.
Berry, Christopher R. and Martin R. West. “Growing Pains: The School Consolidation Movement and Student Outcomes.” The Journal of Law, Economics, and Organization, 2010. Findings: district consolidation associated with modestly higher educational attainment; school consolidation (larger schools) associated with lower wages and returns to education. academic.oup.com/jleo/article-abstract/26/1/1/913468
Beuchert, Louise et al. “The short-term effects of school consolidation on student achievement: Evidence of disruption?” Economics of Education Review, 2018. Findings: initial dip in performance returns to pre-consolidation levels within four years. doi.org/10.1016/j.econedurev.2018.05.001
Vermont legislative history and H.955
Act 73 (H.454), signed July 1, 2025. Bill status: legislature.vermont.gov/bill/status/2026/H.454
H.955, as passed by the House, May 15, 2026. Creates 7 CESAs, mandates study committees, delays foundation formula to 2030. legislature.vermont.gov (H.955 PDF)
Campaign for Vermont analysis: estimated ~$300 million potential savings from shared services at 15 CESAs; noted inefficiencies at scale of 7 CESAs averaging 1,380 sq mi. campaignforvermont.org/4_16_2026_aa
Campaign for Vermont, March 14, 2026 legislative update: Senate bumped foundation formula base to $16,780/student, pushed implementation to July 1, 2029. campaignforvermont.org/3_14_2026_leg_update
Redistricting Task Force Legislative Report, December 2025. aoa.vermont.gov (PDF)
Mississippi and Louisiana education reform
Wikipedia, “Mississippi Miracle”: Mississippi rose from 49th to 9th in 4th grade reading (2013-2024); Louisiana from 42nd to 11th. en.wikipedia.org/wiki/Mississippi_Miracle
PBS News, “Kids’ reading scores have soared in Mississippi ‘miracle,’” May 2023. Mississippi invested $15M to train 8,000 teachers; placed 60 literacy coaches in lowest-performing schools. pbs.org/newshour/education/kids-reading-scores-have-soared-in-mississippi-miracle
The Conversation / Washington Post, “Reading gains in states are often touted, but don’t show full picture of literacy,” April 2026. Mississippi’s 2013 Literacy-Based Promotion Act combined early screening, teacher training, literacy coaching, and support. theconversation.com (link)
Art Woolf, “Education” and “Vermont’s Education Quality,” Davis Dewey is Rich (Substack). Demographically adjusted NAEP analysis; Louisiana comparison. artwoolf.substack.com/p/education; artwoolf.substack.com/p/vermonts-education-quality
Dashboard and prior analysis
vtact73.com: Interactive dashboard with JFO preliminary modeling, spending trends, NAEP outcomes, demographics, and legislative timeline. vtact73.com
David Tyler, “Vermont’s Education Spending Problem, in Charts,” Substack. davidtyler.substack.com/p/vermonts-education-spending-problem